Read this article below By Francis Menton
Don’t be too surprised that you’re not reading much recently about the impending climate apocalypse and the supposed “hottest year,” “hottest month,” or “hottest day” ever. The reason is that global lower troposphere temperatures, as measured by satellites and published by UAH, are down by more than 0.7 deg C since early 2016. That’s well more than half of what was thought to be the temperature increase since the satellite record began in 1979. September 2018 turned out to be the coolest September in ten years.
But inquiring minds are still eager to get to the bottom of the temperature adjustment scandal that has created a fake warming trend in the so-called “surface temperature” record that goes back into the mid-1800s. For those unfamiliar with this field, the “surface temperature” record comes from a totally different source from the satellite record, namely a network of conventional thermometers, each located a few feet above the ground, scattered around the world. The data from the surface thermometers is collected and published by three entities, two in the U.S. (NASA and NOAA) and one in England (the Hadley Center at the Climatic Research Unit of the University of East Anglia). Those three use somewhat different but substantially overlapping surface thermometers to compile their records. All three show a noticeable warming trend in the range of 1.5 deg C since the late 19th century.
But is the warming trend real, or is all or most of it an artifact of temperature adjustments made to the record over time? Many have noticed that substantial downward adjustments have been made to raw temperatures recorded at many of the stations in the surface thermometer networks during the earlier part of the record, mainly from the mid-1800s through 1950s. This issue has been the principal focus of my series The Greatest Scientific Fraud Of All Time. This is now Part XIX of that series.
Here’s the new development: A guy named John McLean has just (October 2018) published a big Report via John Boyle Publishing, essentially consisting of an expanded and updated version of his 2017 Ph.D. thesis for James Cook University in Australia. For his thesis, McLean elected to conduct an “audit” of one of the surface temperature records, that of the Hadley Center at UEA, a series known as HadCRUT4. The HadCRUT4 series is the main series relied on by the IPCC for its warnings of climate alarm propounded to the governments of the world. The full McLean Report is behind a pay wall, where it can be purchased for $8. I have purchased a copy. The Executive Summary and some other excerpts can be found at Watts Up With That here.
McLean’s audit is scathing in many respects. He covers everything from impossibly crazy temperature readings that nobody bothers to examine or correct (one town in Colombia records a three-month period with an average temperature over 80 deg C, which is 176 deg F) to ridiculous sparsity of data (in some of the early years, the entire southern hemisphere has only one land-based weather station), and so on. The overall conclusion:
Governments and the United Nations Framework Convention on Climate Change (UNFCCC) rely heavily on the IPCC reports so ultimately the temperature data needs to be accurate and reliable. This audit shows that it is neither of those things.
By all means buy the Report and read it if you have the time. In this post I’m going to focus mainly on one portion of it, which is the part that addresses the issue of the early-year downward temperature adjustments.
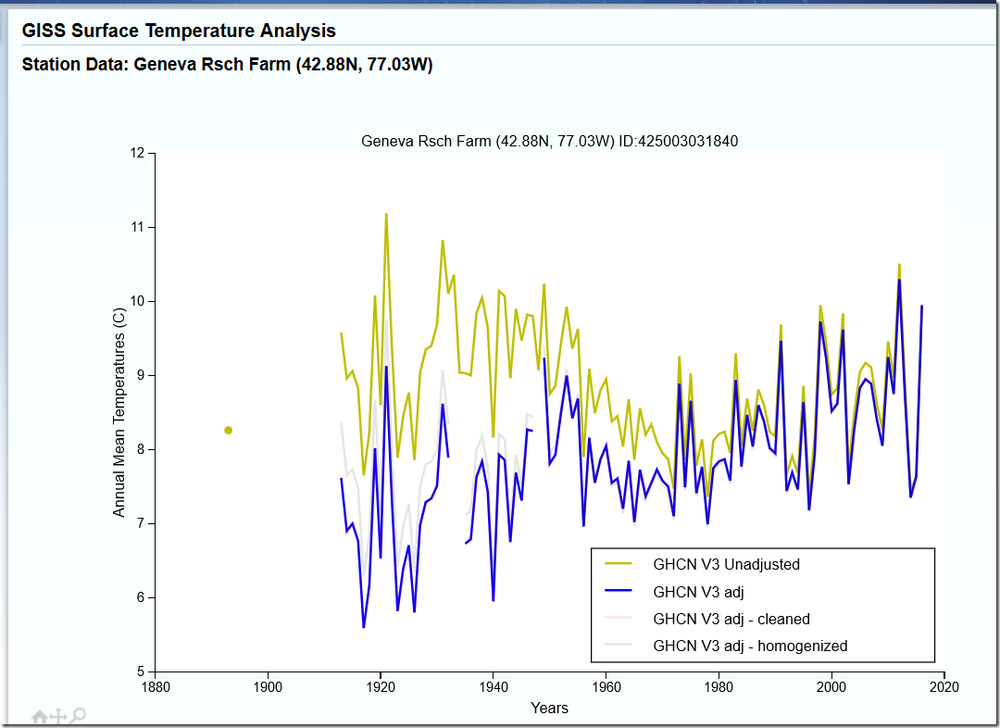
For extensive background on this temperature-adjustment issue, you can read the previous posts in this series. To make it a little easier to grasp, I’ll throw in this graph from Part XVIII of the series, posted in January of this year. This graph shows current and earlier versions of temperature data from the station at Geneva in upstate New York. Note that this data is from GISS (NASA) rather than HadCRUT, but the adjustment issues are comparable:
Somehow temperatures prior to 1950 have been adjusted downward by in excess of 2 deg C; and between 1950 and 1970 by in excess of 1 deg C. That’s one way to create a strong warming trend! But how has that been done, and how do we know that the adjustments are appropriate? None of NASA, NOAA or Hadley/CRU have been forthcoming with anything approaching an adequate explanation.
Now McLean weighs in with some insights. From the Executive Summary:
Another important finding of this audit is that many temperatures have been incorrectly adjusted. The adjustment of data aims to create a temperature record that would have resulted if the current observation stations and equipment had always measured the local temperature. Adjustments are typically made when station is relocated or its instruments or their housing replaced.
The typical method of adjusting data is to alter all previous values by the same amount. Applying this to situations that changed gradually (such as a growing city increasingly distorting the true temperature) is very wrong and it leaves the earlier data adjusted by more than it should have been. Observation stations might be relocated multiple times and with all previous data adjusted each time the very earliest data might be far below its correct value and the complete data record show an exaggerated warming trend.
There is much more on this subject in the body of the Report, particularly pages 82 to 86. McLean asserts that something like the following is a frequent occurrence: A measuring site, originally located in an undisturbed rural area, gradually becomes surrounded by urban build-up, and becomes subject to the urban heat island effect. Thus, the temperatures it is recording are “too high” at least as compared to some theoretical un-affected “true” temperature. At some point, the station is appropriately moved to a new location without the urbanization. The difference between the temperatures recorded at the new and old locations is calculated. And then - and here is the key error - the temperatures at the old location are adjusted downward by the amount of that difference, for all times going back to the beginning of the station. But here’s the error: in its early years, the station was not affected by an urban heat island, so temperatures from that period should not be adjusted downward. Yet they are. From page 84 of the Report:
It is incorrect but seemingly common to apply a constant adjustment to all data from the first site according the calculated difference between it and the second site when the data at the first site has been distorted by gradual changes in the local environment. It defies logic that a location that was abandoned because it was contaminated by external influences was equally contaminated when the observation station was first established there and throughout the entire time that the station was at that site, but this is what a constant data adjustment implies.
So, can an independent researcher at least be given the adjustment methodology so that the process can be reverse-engineered and corrected? From page 82:
Much of the observation station data used in HadCRUT4 is likely to have been adjusted but there is no record of the method used or the amount of the adjustment, which makes the data impossible to independently audit.
In short, there is no getting to the bottom of the temperature-adjustment scandal, because the perpetrators have created no record to make it possible to figure out what they have done or to attempt to reproduce their work.
Final question: Is there any possibility that this is done innocently, as opposed to an intentional effort to engineer a fake record to support the cause of climate alarm?
OK, this is just one young guy doing some due diligence. But the fact is, he has nailed the grand pooh-bahs with obvious data manipulation to achieve their desired result. Do you expect any kind of response from the in crowd? I don’t.
I’ll end with some conclusions from the Executive Summary:
The primary conclusion of the audit is however that the dataset shows exaggerated warming and that global averages are far less certain than have been claimed.
One implication of the audit is that climate models have been tuned to match incorrect data, which would render incorrect their predictions of future temperatures and estimates of the human influence of temperatures.
Another implication is that the proposal that the Paris Climate Agreement adopt 1850-1899 averages as “indicative” of pre-industrial temperatures is fatally flawed. During that period global coverage is low - it averages 30% across that time - and many land-based temperatures are very likely to be excessively adjusted and therefore incorrect.
A third implication is that even if the IPCC’s claim that mankind has caused the majority of warming since 1950 is correct then the amount of such warming over what is almost 70 years could well be negligible. The question then arises as to whether the effort and cost of addressing it make any sense.
Ultimately it is the opinion of this author that the HadCRUT4 data, and any reports or claims based on it, do not form a credible basis for government policy on climate or for international agreements about supposed causes of climate change.
No comments:
Post a Comment
Climate Science welcomes your views/messages.