Below is a clip from Roy Spencer's excellent blog giving the update to the earth's surface temperature (or strictly speaking the lower atmosphere).
The Version 6.0 global average lower tropospheric temperature (LT) anomaly for October, 2018 was +0.22 deg. C, up a little from +0.14 deg. C in September:
The Version 6.0 global average lower tropospheric temperature (LT) anomaly for October, 2018 was +0.22 deg. C, up a little from +0.14 deg. C in September:
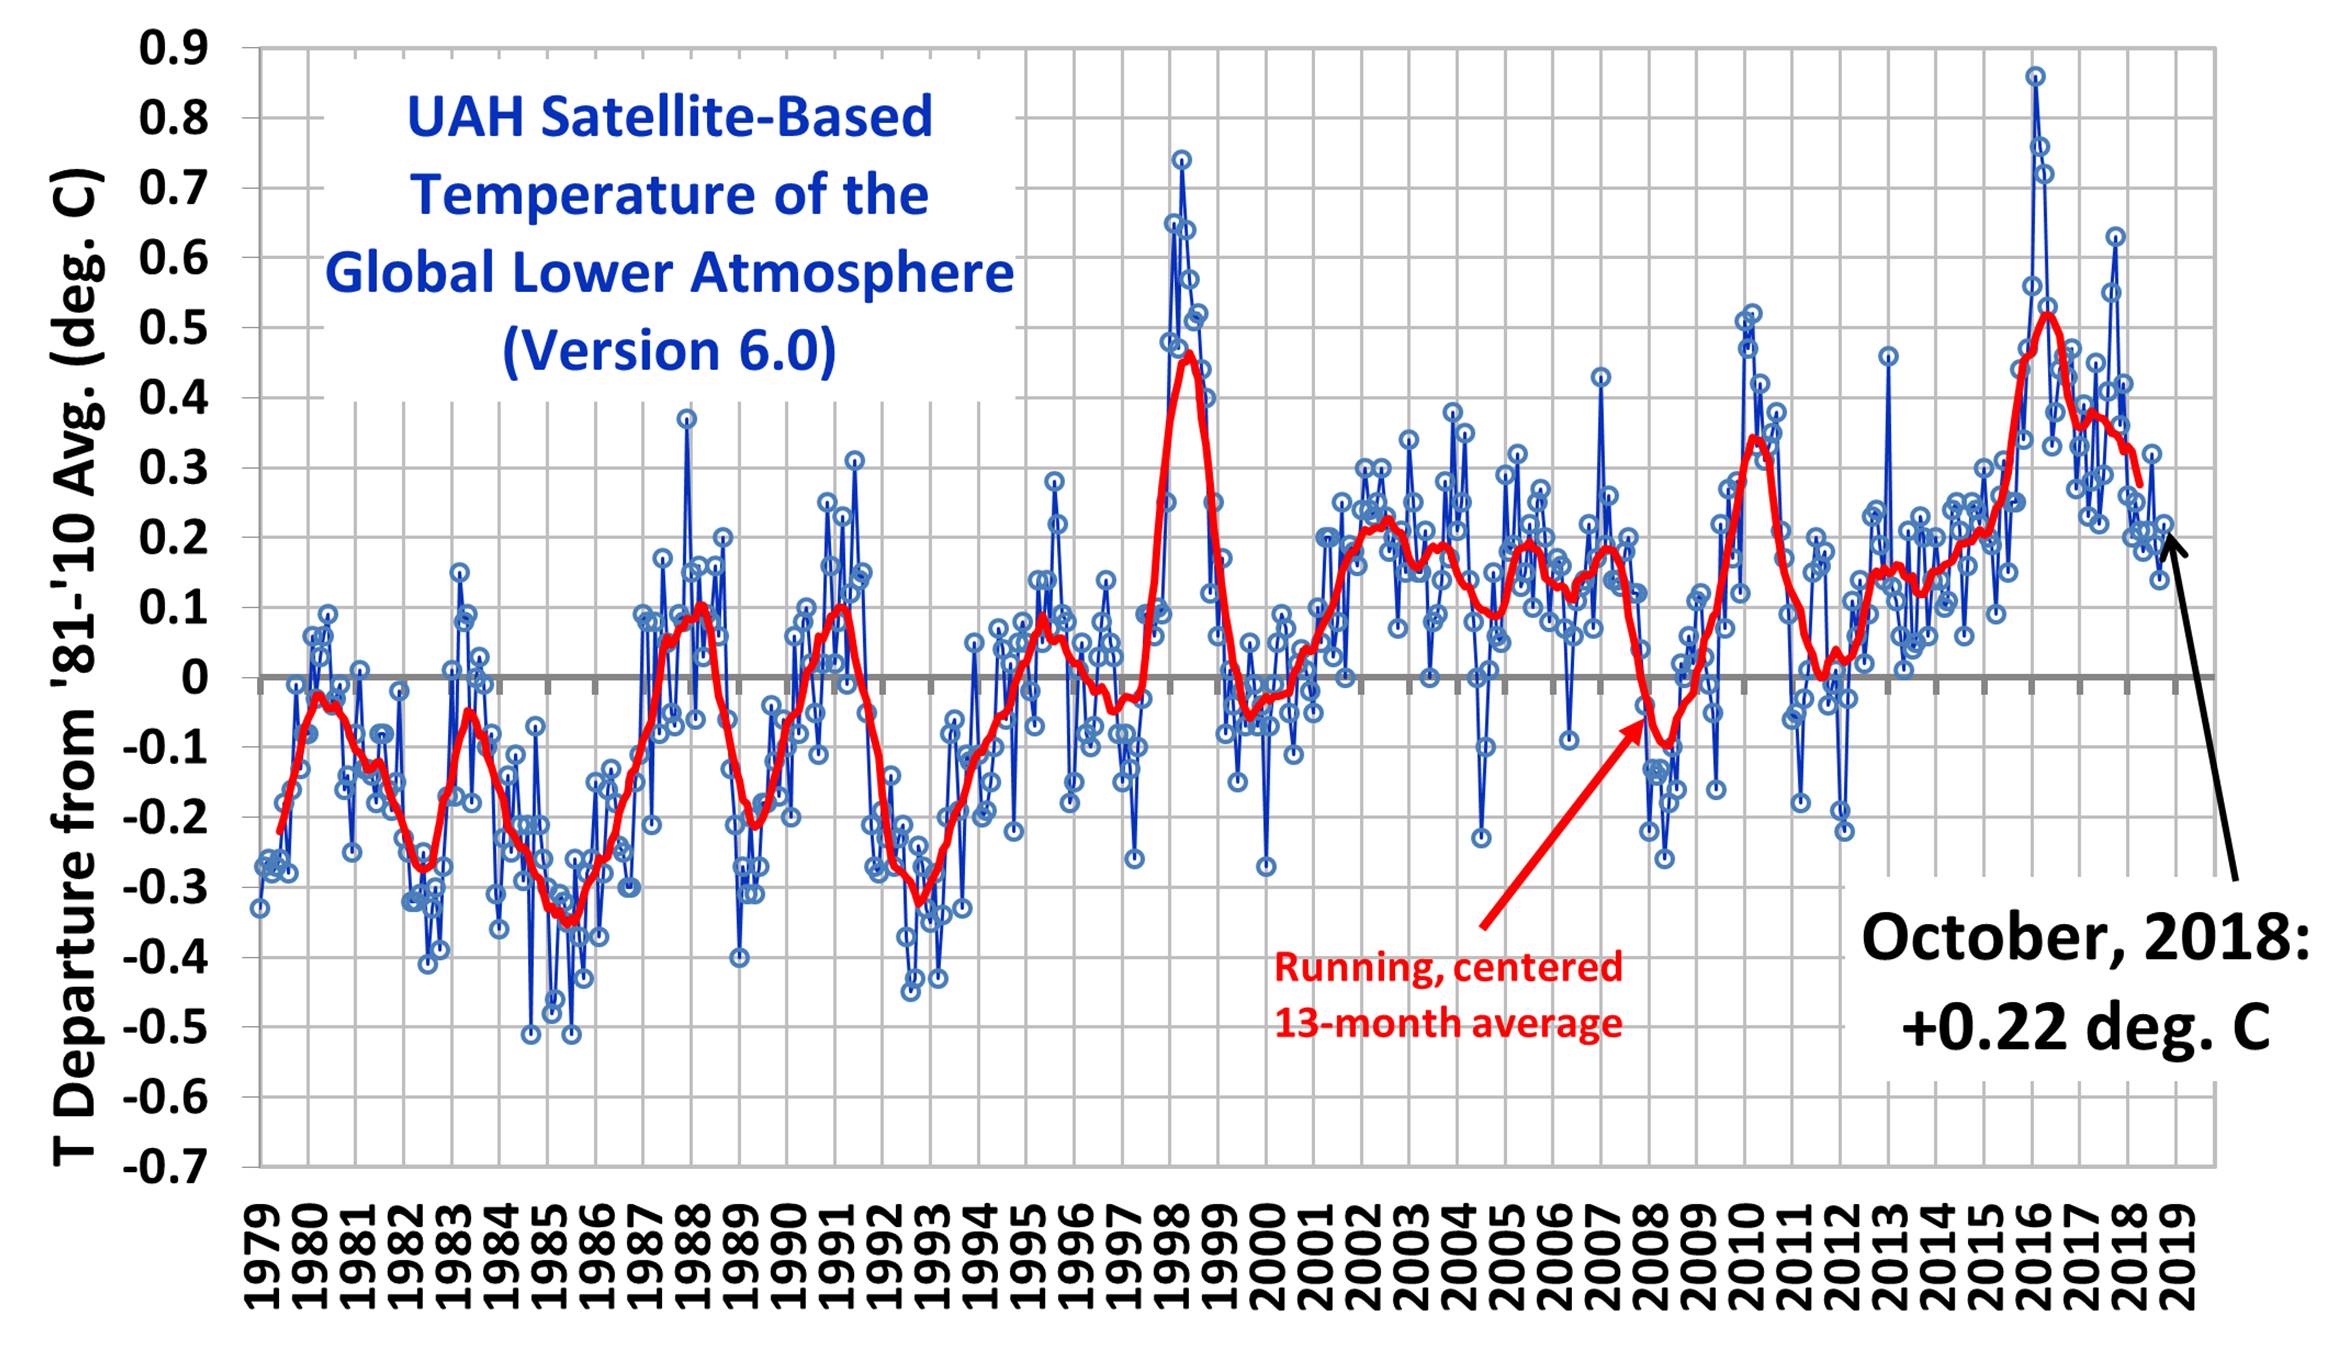
Global area-averaged lower tropospheric temperature anomalies from 1981-2010 mean). The 13-month centered average smooths out the extremes.
The graph shows a definite average increase over
the 39 year period of around 0.5 degrees C which
equates to about 0.12 degrees per decade or 1.2
degrees per century. This is the root of the global
warming scare. When you see the actual numbers
it seems like a lot of fuss about very little.
the 39 year period of around 0.5 degrees C which
equates to about 0.12 degrees per decade or 1.2
degrees per century. This is the root of the global
warming scare. When you see the actual numbers
it seems like a lot of fuss about very little.
No comments:
Post a Comment
Climate Science welcomes your views/messages.